Sunday, March 13, 2022

How is your relationship with Artificial Intelligence?


What does it mean AI (Artificial Intelligence)?

 Artificial intelligence (AI) is a new technology that attempts to imitate human thinking in AI systems. In 1950, John McCarthy coined the phrase "Artificial Intelligence." It is the science and engineering of making intelligent machines, especially intelligent computer programs. It is related to the similar task of using computers to understand human intelligence, but AI does not have to confine itself to methods that are biologically observable.

AI is quietly diminishing human-to-human interactions and rapidly transforming the world into a self-driving car. Advances in mass manufacturing and supply chain administration are aimed at gratifying every customer since their satisfaction provides various reasons why a specific sector should lead and dominate the international market.

The capacity of a software program to learn and the reason is referred to as artificial intelligence. Everything that includes software accomplishing something that we would ordinarily imagine would require the intelligence of a person is termed artificial intelligence.


Does your company follow the new technology of Artificial Intelligence?

In today’s world, technology is quite developed. Most the businesses are getting benefit from it. Consumers can interact with AI throughout the day, from Fitbit’s fitness tracker and Alibaba’s Tmall Genie smart speaker to Google Photo’s editing suggestions and Spotify’s music playlists. (Puntoni et al., 2022, p. 131). Internet of Things, Robotics, and Virtual Reality are some examples of this technology. Artificial Intelligence is the most popular and effective one that implements almost all area.


What are the Benefits of AI?

This amazing technology offers many services including content creation, chatbots, and search engines, which have particularly ramped up since the start of the COVID-19 pandemic. (Dave, 2021)

The benefits of artificial intelligence applications are vast, and they have the potential to change any professional field. Let's have a look at some of them.

1) Human Error Reduction:

Computers, on the other hand, do not make these errors if they are correctly programmed. Artificial intelligence makes choices based on previously obtained data using a certain set of algorithms. As a result, mistakes are decreased, and the prospect of achieving better accuracy with greater precision exists. For example, in weather forecasting, AI has decreased the bulk of human mistake.

2)Humans are not the only ones who take risks:

This is one of the most significant benefits of artificial intelligence. We can solve many of humanity's risky restrictions by constructing an AI robot that can perform the risky activities for us. Intelligence Robots can be utilized in circumstances when human interaction is risky.


3)Available 7x24 :

A typical human will labor for 4–6 hours each day, without breaks. Humans are designed in such a manner that they may take some time off to renew themselves and prepare for a new day of work, and they even have week offfed to keep up with their job and personal life. However, utilizing AI, we can have robots operate 24 hours a day, seven days a week, and they never grow bored, unlike humans.


4) Digital Assistance:

Some of the most modern firms connect with users via digital assistants, which reduces this need human personnel. Many websites also utilize digital assistants to help consumers with what they desire. We can discuss what we're searching for with them. Some chatbots are created in such a manner that it is difficult to tell if we are conversing with a chatbot or a real being.


 5) Decide Faster:

Using AI in conjunction with other technologies, we can make computers make judgments and carry out activities faster than humans. When making a choice, humans consider numerous things, both emotionally and practically, but an Automation machine works on how much is taught to do and produces results faster.

6) New Creation:

AI is powering several inventions in nearly every discipline, which will assist humans in solving the bulk of complicated issues.

7) Assisting with Repetitive Tasks:

We can use artificial intelligence to efficiently automate these routine processes and even remove "boring" work for people, freeing them up to be more creative.


Figure 1:Conversational Marketing with computer and consumers.

                                                                    Source: Dave


How AI helps the Travel Industry?

AI Assistants For Travel Booking

AI assistants and smart chatbots have largely replaced travel agents, allowing passengers to book flights, hotels, and car rentals online. Some big travel reservation companies implemented this technology into their businesses such as booking.com. 

Typically, you will be asked to begin a discussion with a chatbot by providing facts about your desired route. The bot will then search across the booking sites to get the best bargain for you. When you enter your travel date, the chatbot will display the cheapest ticket to your location.

Face-to-Face Customer Service Robots

Robots are progressively invading the travel industry's customer service, obviating the necessity for human representatives. Gone are the days when you had to stand in line for info or try to find your flight in a crowded terminal. The reason for this is because certain well-known airports and hotels have now hired robots to assist you in such circumstances.


Intelligent Baggage Handling

Every year, airports handle millions of luggage. In the future, airports will be totally automated using robots and AI, and misplaced luggage would be handled intelligently. AI technologies have already been introduced in certain airports as experimental projects.


Voice Assistants and Robots

As a result of the Covid-19 epidemic, specialists are searching for more advanced contactless methods for check-in and checkout operations, as well as supporting travelers with general concerns. As a result, in the post-pandemic age, self-service may become the norm. Voice assistants are already widely utilized in hotel rooms, cruises, and airport security. With the current state of affairs, the sector can anticipate the emergence of both robots as well as voice assistants.


References

  1.  Puntoni, S., Reczek, R.W., Giesler, M.&Botti, S. (2021) “Consumers and Artificial Intelligence: An Experiential Perspective”, Journal of Marketing, 85(1), pp. 131-151. Business Sources Complete, Accessed:8 March 2022)
  2. Dave, N (2021)”38 Digital Marketing Trends You Can’t Ignore in 2022” , Single Grain. Available at : https://www.singlegrain.com/digital-marketing/digital-marketing-trends-2022/ (Accessed:06 March 2022) 
  3. Kumar,S (2019)"Advantages and Disadvantages of Artificial Intelligence" Available at: https://towardsdatascience.com/advantages-and-disadvantages-of-artificial-intelligence-182a5ef6588c (Accessed:07 March 2022)

L  Keywords:

#a#artificialintelligence #technology #travelindustry #digitalmarketing #AI

Author: Ece Kubra Basci

Sunday, March 6, 2022

Data Visualization in travel industry

 What is Data Visualization?

Data visualization is a graphical representation of data and information by using visual elements such as maps, graphs, and charts. In the travel industry, data visualisation represents data related to get information about recent COVID-19 pandemic impact on the industry by identifying tourist arrivals, travel restrictions, massive loss, and so on. Travel and tourism industry has maintained big data by managing national and international business with involvement on different flights from different countries. In that case, data visualisation is needed to manage information and keep record of data to visually represents the situation for which flight can be cancelled and can be start based on recovery of pandemic COVID-19. Data visualization tools help to maintain an accessible way of understanding, seeing, and reviewing patterns, trends, and outliers in data that improve financial improvement in travel industry by reviewing number of customers’ attractions. It helps to analyse massive information and big data to make decisions by calculating those through using technologies and tools (Tableau, 2022). The main importance of data visualisation is to make it easier of identifying patterns, trends and outliers of large data sets by using human brain. The main examples of data visualisation are charts, graphs, tables, maps, dashboards, and infographics. Another data visualization process is Gantt chart, histogram, bar chart, matrix, scatter plot, network, radial tree, area chart, dot distribution map, timeline, tree-map, word cloud, text tables, streamgraph, and so on. Industrial big data has been analysed by using data visualisation to make decisions about business conditions by maintaining creative storytelling. Data visualisation helps organisations to identify key performance indicators (KPIs) and information.


Figure 1: Worldwide data visualization market value in 2017 and 2023

(Source: Statista,2019)

The aforementioned figure indicates market revenue of global data visualisation in 2023 and 2017 that impacts market value. In 2017, worldwide data visualisation market value is 4.51 billion US dollars and in 2023, it can reach up to an estimated 7.76 billion US dollars with a CAGR of 9.47% over the forecast period (Statista, 2019)Travel industry has improved their business position by visualising data because it helps them to predict future performance by maintaining huge information securely. Based on that data analytics team needs to be hired for maintaining this process to visualise their statistical information. It has proved that many industries have introduced data visualization in their business to maintain financial performance evaluation by using charts, graphs, tables, and maps. For example, IBM has launched data visualisation tools to integrate cognitive computing technology by including use of machine learning and artificial intelligence (AI), which make it an easier process to visualise real-time and trusted data (IBM, 2022). The main benefits of data visualization are related to calculating accurate big data visualisation by avoiding IT involvement and specialist visualisation. IBM has launched IBM Cognos Analytics to maintain data visualisation by using analytics software and AI-fuelled business intelligence technology to help users to search for data insights. Data visualisation also helps to attract travellers by providing them visualise data through publishing their annual report and advertisements by offering discounts and offers while visualise data represents lack of financial improvement.


Data visualisation helps to analyse data by gaining actionable insights to improve decision-making business intelligence. It has many important benefits in maintaining industrial financial data evaluation through making a record of their improvement. Visualised data or content helps to analyse data transmission by evaluating use of human brains to get a faster understanding power to make sense. This is a faster process by which people brain easily recognise business operations with neural networks to predict data through visualising information (Sales force, 2022). Human mind is not able to analyse complex statistical models to evaluate data for which data visualisation process by which hierarchy of an organisation quickly grasps the pulse of concerned organisation. Big data and data visualisation can benefit the travel industry in different ways by allowing them to enhance evidence-driven decisions. These can be improved the ability to anticipate future demand of the industry in an accurate way to improve customer experience, target marketing precisely, and optimise pricing strategies.

Data visualisation help people by giving actionable items to make an evaluation of organisational performance, and its accuracy such as high or low. Lack of economic stability of organisation has been analysed by using data visualisation that forces the organisation to enhance their economic stability by improving future performance through increasing staff engagement, technological advancement, and strategical implementations. Data visualisation helps to evaluate big data of companies by illustrating case scenarios of companies (Venkatraman and Venkatraman, 2019). Big Data journey helps an organization to enable their scalable infrastructure for achieving organisational mission by managing critical decision-making through using data visualisation. It helps to track changes in number of visitors in the travel industry by providing a breakdown of tourists as well as ranks destinations to identify nationality of foreign tourists by giving demographic profile information of domestic tourists such as gender, age, and country. Data visualisation helps to bring trust in organisations by managing real-time information based on economic performances such as revenue, growth, market share, profit, sales, production, and so on.

Actionable items have the ability to provide a result of organisations by identifying areas for improvement and success. Data visualisation also help to increase productivity and sales by evaluating results of financial performances. It has the power to influence high-resolution by evaluating data based on getting information from presentations (Semple et al. 2019). Data visualisation produces provide real results by saving time in creating up-to-date reports with greater efficiency company-wide. It also emphasises financial performance of organisations by identifying its lack of improvement that affects its employees and staff to enhance more effort to stabilise economic stability by avoiding uncertainties. Stakeholders of travel industry maintain their data visualisation to evaluate performance level and whether it can be improved or not to maintain economic growth for the industry as well as the country.

 Data visualisation is the interactive computing task that overwhelmingly performed improvement by using flat screens (Liu et al. 202). It has some challenges based on maintaining huge investments to get better results by identifying design problems to represent data. In case an organisation embraces data visualisation to see rewards, their bottom-line improvement has been identified and most of the companies are planning to invest more in data visualisation due to their leading revenue growth.

In the travel industry, data visualisation helps to evaluate environment by maintaining rapid advancements of technologies such as AR and VR in organisations to enhance their performance and improve exciting possibilities. These technologies have enhanced customer attraction by providing 360-degree video and photography of hotel or travel information. Travel industry uses data visualisation for representing their performance that depends on evaluating chart, graphs, and tables related to revenue, growth, number of customers, and others. For example, FIESTA has been designed to allow users for creating, manipulate and share data visualisation while freely moving in a co-located VR environment physically (Lee et al. 2020). Data visualisation is the intelligent analysis process that helps teachers to assist study in educational institutions by using exploratory learning to teach students in a better way by evaluating their performances. It has helped to improve using of computer-based knowledge by stimulating performances through analysing data interaction (Mavrikis et al. 2019). Data visualisation is not only helpful for industrial improvement, as well as educational institutions to analyse data and information. Thus, it can be said that travel industry has improved economic growth by using data visualisation that helps to influence organisational staff involvement for identifying financial results and lack of economic stability to enhance engagement of employees to get better improvement.

Reference List

IBM., (2022). Data Visualization Tools & Solutions _ IBM. Available at: https://www.ibm.com/analytics/data-visualization [Accessed on: 16 February, 2022]

Lee, B., Hu, X., Cordeil, M., Prouzeau, A., Jenny, B. and Dwyer, T., (2020). Shared surfaces and spaces: Collaborative data visualisation in a co-located immersive environment. IEEE Transactions on Visualization and Computer Graphics27(2), pp.1171-1181.

Liu, J., Prouzeau, A., Ens, B. and Dwyer, T., (2020), March. Design and evaluation of interactive small multiples data visualisation in immersive spaces. In 2020 IEEE Conference on Virtual Reality and 3D User Interfaces (VR) (pp. 588-597). IEEE.

Mavrikis, M., Geraniou, E., Gutierrez Santos, S. and Poulovassilis, A., (2019). Intelligent analysis and data visualisation for teacher assistance tools: The case of exploratory learning. British Journal of Educational Technology50(6), pp.2920-2942.

Sales force., (2022). Top 5 data visualisation advantages – Salesforce. Available at: https://www.salesforce.com/ap/resources/articles/data-visualization-advantages/ [Accessed on: 15 February, 2022]

Semple, T.L., Peakall, R. and Tatarnic, N.J., (2019). A comprehensive and user‐friendly framework for 3D‐data visualisation in invertebrates and other organisms. Journal of morphology280(2), pp.223-231.

Statista., (2019). Global data visualization market size 2017 and 2023 _ Statista. Available at: https://www.statista.com/statistics/1003906/worldwide-data-visualization-market-value/ [Accessed on: 14 February, 2022]

Tableau., (2022). What Is Data Visualization_ Definition & Examples _ Tableau. Available at: https://www.tableau.com/learn/articles/data-visualization#:~:text=Data%20visualization%20is%20the%20graphical,outliers%2C%20and%20patterns%20in%20data. [Accessed on: 17 February, 2022]

Venkatraman, R. and Venkatraman, S., (2019, August). Big data infrastructure, data visualisation and challenges. In Proceedings of the 3rd International Conference on Big Data and Internet of Things (pp. 13-17).

Author: Pooja Sudhakar Sankhe

Keywords: #Travel #Data Visualization #travel industry #visualisation#Data#COVID-19

Saturday, February 26, 2022

Variety- Data Structure and Types in Travel Industry


VARIETY- DATA STRUCTURE AND TYPES


What is the Data Structure

A data structure is a specialized format for organizing, processing, retrieving and storing data. There are several basic and advanced types of data structures, all designed to arrange data to suit a specific purpose. Data structures make it easy for users to access and work with the data they need in appropriate ways. Most importantly, data structures frame the organization of information so that machines and humans can better understand it.

In computer science and computer programming, a data structure may be selected or designed to store data for the purpose of using it with various algorithms. In some cases, the algorithm's basic operations are tightly coupled to the data structure's design. Each data structure contains information about the data values, relationships between the data and -- in some cases -- functions that can be applied to the data.

For instance, in an object-oriented programming language, the data structure and its associated methods are bound together as part of a class definition. In non-object-oriented languages, there may be functions defined to work with the data structure, but they are not technically part of the data structure.

Why Data Structure is Important?

Typical base data types, such as integers or floating-point values, that are available in most computer programming languages are generally insufficient to capture the logical intent for data processing and use. Yet applications that ingest, manipulate and produce information must understand how data should be organized to simplify processing. Data structures bring together the data elements in a logical way and facilitate the effective use, persistence and sharing of data. They provide a formal model that describes the way the data elements are organized.

Data structures are the building blocks for more sophisticated applications. They are designed by composing data elements into a logical unit representing an abstract data type that has relevance to the algorithm or application. An example of an abstract data type is a "customer name" that is composed of the character strings for "first name," "middle name" and "last name."

Data Structure Types

The data structure type used in a particular situation is determined by the type of operations that will be required or the kinds of algorithms that will be applied. The various data structure types include the following:

1. Arrays

An array is a structure of fixed-size, which can hold items of the same data type. It can be an array of integers, an array of floating-point numbers, an array of strings or even an array of arrays (such as 2-dimensional arrays). Arrays are indexed, meaning that random access is possible.


Fig 1. Visualization of basic Terminology of Arrays (Image by author)

Array operations

Traverse: Go through the elements and print them.

Search: Search for an element in the array. You can search the element by its value or its index

Update: Update the value of an existing element at a given index

Inserting elements to an array and deleting elements from an array cannot be done straight away as arrays are fixed in size. If you want to insert an element to an array, first you will have to create a new array with increased size (current size + 1), copy the existing elements and add the new element. The same goes for the deletion with a new array of reduced size.

Applications of arrays

Used as the building blocks to build other data structures such as array lists, heaps, hash tables, vectors and matrices.

Used for different sorting algorithms such as insertion sort, quick sort, bubble sort and merge sort.

2. Linked Lists

A linked list is a sequential structure that consists of a sequence of items in linear order which are linked to each other. Hence, you have to access data sequentially and random access is not possible. Linked lists provide a simple and flexible representation of dynamic sets.

Elements in a linked list are known as nodes.

Each node contains a key and a pointer to its successor node, known as next.

The attribute named head points to the first element of the linked list.

The last element of the linked list is known as the tail.


Fig 2. Visualization of basic Terminology of Linked Lists (Image by author)

Following are the various types of linked lists available.

Singly linked list — Traversal of items can be done in the forward direction only.

Doubly linked list — Traversal of items can be done in both forward and backward directions. Nodes consist of an additional pointer known as prev, pointing to the previous node.

Circular linked lists — Linked lists where the prev pointer of the head points to the tail and the next pointer of the tail points to the head.

Linked list operations

Search: Find the first element with the key k in the given linked list by a simple linear search and returns a pointer to this element

Insert: Insert a key to the linked list. An insertion can be done in 3 different ways; insert at the beginning of the list, insert at the end of the list and insert in the middle of the list.

Delete: Removes an element x from a given linked list. You cannot delete a node by a single step. A deletion can be done in 3 different ways; delete from the beginning of the list, delete from the end of the list and delete from the middle of the list.

Applications of linked lists

Used for symbol table management in compiler design.

Used in switching between programs using Alt + Tab (implemented using Circular Linked List).

3. Stacks

A stack is a LIFO (Last In First Out — the element placed at last can be accessed at first) structure which can be commonly found in many programming languages. This structure is named as “stack” because it resembles a real-world stack — a stack of plates.

Stack operations

Given below are the 2 basic operations that can be performed on a stack. Please refer to Figure 3 to get a better understanding of the stack operations.

Push: Insert an element on to the top of the stack.

Pop: Delete the topmost element and return it.


Fig 3. Visualization of basic Operations of Stacks (Image by author)

Furthermore, the following additional functions are provided for a stack in order to check its status.

Peek: Return the top element of the stack without deleting it.

Empty: Check if the stack is empty.

Full: Check if the stack is full.

Applications of stacks

Used for expression evaluation (e.g.: shunting-yard algorithm for parsing and evaluating mathematical expressions).

Used to implement function calls in recursion programming.

4. Queues

A queue is a FIFO (First In First Out — the element placed at first can be accessed at first) structure which can be commonly found in many programming languages. This structure is named as “queue” because it resembles a real-world queue — people waiting in a queue.


Queue operations

Given below are the 2 basic operations that can be performed on a queue. Please refer to Figure 4 to get a better understanding of the queue operations.

Enqueue: Insert an element to the end of the queue.

Dequeue: Delete the element from the beginning of the queue.


Fig 4. Visualization of Basic Operations of Queues (Image by author)


Applications of queues

Used to manage threads in multithreading.

Used to implement queuing systems (e.g.: priority queues).

5. Hash Tables

A Hash Table is a data structure that stores values which have keys associated with each of them. Furthermore, it supports lookup efficiently if we know the key associated with the value. Hence it is very efficient in inserting and searching, irrespective of the size of the data.

Direct Addressing uses the one-to-one mapping between the values and keys when storing in a table. However, there is a problem with this approach when there is a large number of key-value pairs. The table will be huge with so many records and may be impractical or even impossible to be stored, given the memory available on a typical computer. To avoid this issue we use hash tables.

Hash Function

A special function named as the hash function (h) is used to overcome the aforementioned problem in direct addressing.

In direct accessing, a value with key k is stored in the slot k. Using the hash function, we calculate the index of the table (slot) to which each value goes. The value calculated using the hash function for a given key is called the hash value which indicates the index of the table to which the value is mapped.

h(k) = k % m

h: Hash function

k: Key of which the hash value should be determined

m: Size of the hash table (number of slots available). A prime value that is not close to an exact power of 2 is a good choice for m.


Fig 5. Representation of a Hash Function (Image by author)


Consider the hash function h(k) = k % 20, where the size of the hash table is 20. Given a set of keys, we want to calculate the hash value of each to determine the index where it should go in the hash table. Consider we have the following keys, the hash and the hash table index.

1 → 1%20 → 1

5 → 5%20 → 5

23 → 23%20 → 3

63 → 63%20 → 3

From the last two examples given above, we can see that collision can arise when the hash function generates the same index for more than one key. We can resolve collisions by selecting a suitable hash function h and use techniques such as chaining and open addressing.

Applications of hash tables

Used to implement database indexes.

Used to implement associative arrays.

Used to implement the “set” data structure.

6. Trees

A tree is a hierarchical structure where data is organized hierarchically and are linked together. This structure is different from a linked list whereas, in a linked list, items are linked in a linear order.

Various types of trees have been developed throughout the past decades, in order to suit certain applications and meet certain constraints. Some examples are binary search tree, B tree, treap, red-black tree, splay tree, AVL tree and n-ary tree.

Binary Search Trees

A binary search tree (BST), as the name suggests, is a binary tree where data is organized in a hierarchical structure. This data structure stores values in sorted order.

Every node in a binary search tree comprises the following attributes.

key: The value stored in the node.

left: The pointer to the left child.

right: The pointer to the right child.

p: The pointer to the parent node.

A binary search tree exhibits a unique property that distinguishes it from other trees. This property is known as the binary-search-tree property.

Let x be a node in a binary search tree.

If y is a node in the left subtree of x, then y.key ≤ x.key

If y is a node in the right subtree of x, then y.key ≥ x.key


Fig 6. Visualization of Basic Terminology of Trees (Image by author)


Fig 6. Visualization of Basic Terminology of Trees (Image by author)

Applications of trees

Binary Trees: Used to implement expression parsers and expression solvers.

Binary Search Tree: used in many search applications where data are constantly entering and leaving.

Heaps: used by JVM (Java Virtual Machine) to store Java objects.

Treaps: used in wireless networking.

Check my articles below on 8 useful tree data structures and self-balancing binary search trees.

8 Useful Tree Data Structures Worth Knowing

An overview of 8 different tree data structures

7. Heaps

A Heap is a special case of a binary tree where the parent nodes are compared to their children with their values and are arranged accordingly.

Let us see how we can represent heaps. Heaps can be represented using trees as well as arrays. Figures 7 and 8 show how we can represent a binary heap using a binary tree and an array.


Fig 7. Binary Tree Representation of a Heap (Image by author)
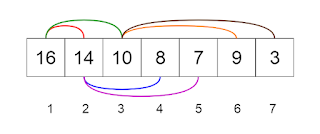


Fig 8. Array Representation of a Heap (Image by author)


Heaps can be of 2 types.

Min Heap — the key of the parent is less than or equal to those of its children. This is called the min-heap property. The root will contain the minimum value of the heap.

Max Heap — the key of the parent is greater than or equal to those of its children. This is called the max-heap property. The root will contain the maximum value of the heap.

Applications of heaps

Used in heapsort algorithm.

Used to implement priority queues as the priority values can be ordered according to the heap property where the heap can be implemented using an array.

Queue functions can be implemented using heaps within O(log n) time.

Used to find the kᵗʰ smallest (or largest) value in a given array.

Check my article below on implementing a heap using the python heapq module.

Introduction to Python Heapq Module

A simple introduction on how to use Python’s heapq module

towardsdatascience.com


8. Graphs

A graph consists of a finite set of vertices or nodes and a set of edges connecting these vertices.

The order of a graph is the number of vertices in the graph. The size of a graph is the number of edges in the graph.

Two nodes are said to be adjacent if they are connected to each other by the same edge.

Directed Graphs

A graph G is said to be a directed graph if all its edges have a direction indicating what is the start vertex and what is the end vertex.

We say that (u, v) is incident from or leaves vertex u and is incident to or enters vertex v.

Self-loops: Edges from a vertex to itself.

Undirected Graphs

A graph G is said to be an undirected graph if all its edges have no direction. It can go in both ways between the two vertices.

If a vertex is not connected to any other node in the graph, it is said to be isolated.


Fig 9. Visualization of Terminology of Graphs (Image by author)


THE TRAVEL INDUSTRY'S DATA SOLUTION

In contrast to some business jargon, big data is precisely what it sounds like. Each airline reservation and hotel stay generates a data trail that is stored in traditional databases, but we are now generating vast swaths of digital data on social media, online review sites, search engines, and retail platforms.

Smartphones have increased the volume: every text, search, call, email, and photo or video we upload or share is stored, frequently in conjunction with our location. Globally, the total volume of data held is increasing at an astounding rate, doubling every 14 months.

The new gold standard is data.

Without a doubt, you've heard the expression 'data is the new gold.' However, just like gold, data must be refined and processed in order to retain any value.

How is the travel industry to make sense of massive amounts of data? As an online travel agent, tour operator, or wholesaler, you can leverage big data to gain insight into your competitors and your own online reputation, as well as to optimize your revenue management and marketing strategy.

Due to the massive amounts of publicly available big data, it can only be collected and processed using artificial intelligence. Today, you can choose from a variety of data analysis firms that specialize in travel-related services and typically charge a monthly fee. Additionally, there are some free tools available, such as Google Analytics.

All of this data can assist you in maintaining competitive pricing and developing dynamic packaging that works for your customers.

Take notes from your competitors.

Typically, data analysis companies provide a service via a dashboard that allows you to view and compare your performance to that of a select number of your competitors. The data is aggregated from a variety of sources (social media, online review sites, and search engines) and presented in an easily digestible format under a series of headings such as sentiment, SEO ratings, reviews, prices, and strategy.

Greater business transparency has been achieved as a result of the digital revolution. Utilize it to the fullest. There is a wealth of information available about your market and your competitors, and it is all freely accessible. Bear in mind that you can never truly comprehend your own performance unless you compare it to that of your competitors.

Take control of your online reputation

On a variety of online platforms and in a variety of different languages, individuals may be writing about your company and the services you provide. Without a mechanism for collecting this feedback, you risk missing out on free publicity (in the case of positive reviews) or the opportunity to correct a service failure or misunderstanding (in the case of bad reviews).

At the most basic level, you can create a Google Alert to monitor whenever your business is mentioned online; however, monitoring and responding to online mentions can be hit-or-miss and time-consuming. If your business has grown to the point where manually monitoring your online reputation is no longer feasible, you will need to hire a data analysis provider.

Typically, both your online reputation and that of your competitors are logged and tracked. However, the primary advantage of such a service is the ability to directly respond to reviews regardless of their source, all from the same online platform. Thus, rather than logging into your Facebook, TrustPilot, and TripAdvisor accounts separately, all of your reviews are consolidated in one location, and you can view and respond to them all from the same online dashboard.

Increase your revenue management efficiency

In the mid-1980s, the airline industry pioneered dynamic pricing with the goal of selling the right product at the right price to the right customer at the right time. Although pricing strategies have evolved significantly since then, this objective remains central to all travel agents' sales and marketing efforts. In modern times, we also use the look to book ratio to ensure that our sales are as efficient as possible.

The significant difference between today and the 1980s is the increased volatility of price movements. Consider a single instance. A customer makes a hotel reservation through your platform. The price of that booking will now change an average of 18 times until check-in time. For you, knowing the optimal time to re-book that stay at the optimal price point would be extremely beneficial, resulting in a savings that will directly benefit your bottom line. However, conventional revenue management techniques are incapable of predicting with certainty when a price will reach its absolute minimum. And this is where big data comes in handy. Hotelmize's proprietary algorithm, which is based on 23 million hotel rates worldwide, enables travel companies to increase margins by up to 30% on bookings already made on their platforms. Additionally, this big data solution operates in the background, requiring no human intervention. Hotelmize's big data technology was applied to 280,000 hotel bookings last year, resulting in a total savings of $15 million, or $53.57 per booking on average.

Refine and concentrate your marketing efforts

Finally, intelligent analysis of your own and competitors' digital footprints enables you to gain a better understanding of your target markets. This enables you to segment your customers into more specific subgroups and target your marketing efforts appropriately.

Big data analytics can be used to forecast demand based on historical performance, seasonal attractions and events, weather, and public and school holidays. Additionally, it can identify emerging trends in travel bookings, such as solo travel, leisure, and digital nomads.

The core strength of big data is its ability to react quickly and competitively to predicted changes in travel demand.

Naturally, the predictive capabilities of big data are limited. Travel is particularly susceptible to unexpected shocks, such as the current coronavirus outbreak. Without a doubt, big data can help here as well, hopefully in terms of positive healthcare and tourism outcomes.

While big data can be an extremely valuable tool, it should never be used to replace or suppress your professionalism in overcoming adversity and increasing profit margins in the tourism industry.


References

1-Loshin, David(2021)’data structure’,Tech target. Avaliable at:

https://searchsqlserver.techtarget.com/definition/data-structure

(Accessed: 24 February 2022)

2- Mallawaarachchi, V.(2020)’ 8 Common Data Structures every Programmer must know’,Towards Data Science. Avaliable at:

https://towardsdatascience.com/8-common-data-structures-every-programmer-must-know-171acf6a1a42 (Accessed: 25 February 2022)

3-Walker,B.(2020)’Big Data Solutions For Travel Industry’,Hotel Mize. Avaliable at:

https://www.hotelmize.com/blog/big-data-solutions-for-the-travel-industry/

(Accessed: 26 February 2022)


Author: Anil(10598717)


KeyWords:#travel#budget#revolution#social#socialmedia#Data#Industry#BigData#World#Marketing#Extension#Hotel#Tourism#Structure#DataTypes#Data Structure

Friday, February 18, 2022

Business intelligence in Travel industry

 What is the business intelligence?

Business intelligence (BI) incorporates the techniques and technology utilized by companies for the facts evaluation and control of enterprise information.The common capabilities of enterprise intelligence technology consist of reporting, on line analytical processing, analytics, dashboard development, facts mining, method mining, complicated occasion processing, enterprise overall performance control, guideline, textual content mining, predictive analytics, and prescriptive analytics.


The role of business intelligence.
  • It gives the higher way to sort the compare and overview information so as far business to make bright decision.
  • companies that take over the business intelligence solution can convert the business data into the ideas and take reasonable rates.
  • Organizations hold and search huge volume of data .

Importance of business intelligence with travel industry

The tour enterprise is incredibly complicated with more than one player and structure interacting with every different on actual time foundation for the clean functioning of the business. The numerous players and structures consist of Travel Management Companies, Global Distribution System Providers, Call Centres, Travel Agencies, etc. Due to those complicated structures, a large quantity of records is generated continuously. But there are massive voids in records series, and this poses as a massive task for the journey enterprise. Travel organizations are for this reason locating it very tough to run centred campaigns; they're neither not able to provide customized products to clients nor make use of Predictive Analytics. However, creation of latest technology is slowly converting the manner journey agencies gather and use records.


Business intelligence and Analytics play a key function in addressing many sales and impacting and operational inefficiencies. When the records is mixed with more than one outside origin like records from the records from the tour companies, online portals, non-public websites and from social media. The intelligence received is extensively offers more insights into client product patterns Such types of insights assist companies examines developments and client’s preferences: -their likes and dislikes point of view. This might then act as an incredibly effective device for devising commercial enterprise techniques and coming across hidden income opportunities.

Data from journey organizations can also additionally display extended opposition with inside the sector. Online portals like ibibio, Make My Trip will offer statistics within side the shape of consumer remarks and blogs, which whilst analyzed, can offer consequences from point of view analysis. It can monitor the representation fairness and affect that client have approximately the organization. If the results aren't favorable, groups can installed more efforts to investigate the motives in the back of it and work an development plan. The processed statistics also can be supplied with inside the shape of reporting dashboards displaying elements affecting client ideas.


Key Performance Indicators For Travel Industry:-

  • Cost and Saving: costs under contract ,booking and payment, cost of managed trip.
  • Traveller conduct and policies: Hotel quality, Hotel visibility, Online Adoption Rate.
  • Suppliers: traveller Satisfaction, Contract Support
  • Process: Re booking Fee, Refund Days
  • traveller Safety: Location Information, Profiling Expertise

Benefits of business intelligence in travel industry:-

  • Enhance consumer division.
  • Increase revenue Targeted gives and promotions.
  • Benchmark towards enterprise standards
  •  Reduce operational cost
  • Competitor insights
  • Increase stock utilization
  •  Improve client service .

Capacity planning, transportation, and performance evaluation are some of the other areas where BI can be used in the travel industry:-

  • Analyse the Mode-Cost
  • Analyse Supplier Compliance
  • Scheduling and Routing
  • Analysis of Driver Performance

Other types of effect of Business Intelligence withinside the tourism sector:-

Business intelligence is utilized in more than one industries across the world. Like maximum industries, the tour enterprise will enjoy the implementation of big-information evaluation solutions. Check right here 4 software examples that display how BI can take the journey enterprise to the subsequent stage of profitability and efficiency.

Business intelligence can assist tour organizations differentiate themselves:-

The powerful use of the Business Intelligence software program in tour businesses and enterprise can assist alternate the customer’s belief of tour. Transportation organizations that use BI correctly benefit a aggressive benefit in the area due to the fact they enhance the general revel in their customers.

With BI, pricing techniques may be configured extra precisely:-

Traveling is expensive, so one of the goals of tour businesses could be to suggest their ability clients the high-quality gives and rates. The most effective manner to do that is to have real-time data approximately the country of the marketplace at a given time.

Business intelligence permits a higher benefit management:-

Travel businesses and agencies have many property to manage, that have to all be capable of make contributions. High overall performance and protection are of the primary targets on this regard.

Possible demanding situations for BI in the tour industry:-

BI permits individuals of this area to advantage a higher information in their clients and offer extra powerful decisions, there also are a few challenges.


References:
Role of Business Intelligence. Available at: https://www.baass.com/blog/the-role-of-business-intelligence#:~:text=Business%20intelligence%2C%20or%20BI%2C%20is,of%20data%20within%20an%20organization.&text=These%20insights%20can%20help%20companies,improve%20revenues%2C%20and%20enhance%20growth (Accessed: 10.02.2022)

Importance of Business Intelligence in the travel industry. Available at: https://helicaltech.com/importance-of-business-intelligence-in-travel-industry/(Accessed: 12.02.2022)

Business Intelligence. Available at: https://onlinetraveltechnology.com/en/business-intelligence-do-not-let-bad-decisions-ruin-your-travel-intermediation-business/#:~:text=In%20general%2C%20Business%20Intelligence%20solutions,your%20company%20from%20the%20rest.(Accessed: 16.02.2022)

Author: Komal

Keywords: #business intelligence #travel #tour #travelindustry

Programmatic Digital Marketing

 Despite being one of the most crucial weapons in your company's armory, programmatic marketing is one of the least understood marketing...